Profiling Go App Menggunakan pprof

Profiling Go App Menggunakan pprof

Melakukan profiling pada suatu sistem sangat berguna untuk mengidentifikasi pemakaian resource pada saat aplikasi berjalan. Kita dapat melihat fungsi apa yang memakai paling banyak CPU atau memori. Kita dapat melihat apakah aplikasi kita sudah efisien atau belum, dan kita dapat mencari cara untuk mengimprovenya. Pada aplikasi Go, kita dapat menggunakan pprof, library built-in untuk profiling yang dapat dengan mudah kita gunakan dan integrasikan.

Bagaimana cara menggunakan pprof

Untuk menggunakan pprof pada aplikasi golang, kita perlu import net/http/pprof dan buat handlers untuk profiling. Kalau aplikasimu adalah web server dan menggunakan HTTP server default, kita bisa tinggal import library nya dengan blank identifier, seperti di bawah ini:

import _ net/http/pprof

Tapi kemungkinan besar kita tidak menggunakan HTTP server default. Kalau begitu kita perlu membuat handlers berikut:

    r.HandleFunc("/debug/pprof/", pprof.Index)
    r.HandleFunc("/debug/pprof/heap", pprof.Index)
    r.HandleFunc("/debug/pprof/cmdline", pprof.Cmdline)
    r.HandleFunc("/debug/pprof/profile", pprof.Profile)
    r.HandleFunc("/debug/pprof/symbol", pprof.Symbol)
    r.HandleFunc("/debug/pprof/trace", pprof.Trace)

Sekarang kita bisa melakukan profiling saat aplikasi kita berjalan.

Bagaimana cara melakukan profiling

Untuk mengetestnya, kita buat handler yang mengambil data dari database, hit third-party API, kemudian melakukan kalkulasi yang memakan banyak CPU.
Lalu kita hit server secara terus menerus selama 5 menit sambil melakukan profiling. Untuk melakukan profiling, kita memanggil API /debug/pprof/profile dan menentukan berapa lama profiling berjalan pada parameter seconds, kemudian simpan hasilnya pada sebuah file. Berikut ini adalah command untuk melakukan profiling dengan curl:

curl --output myappprofile "localhost:4560/debug/pprof/profile?seconds=300"

Tunggu sampai profiling selesai kemudian kita bisa analisa hasilnya.

Bagaimana cara menganalisa hasil pprof

Setelah kita dapatkan file hasil pprof, kita dapat menganalisanya menggunakan go tool pprof. Kita dapat menganalisanya dengan command line interaktif atau dengan web interface.
Untuk membukanya dalam command line interaktif:

go tool pprof myappprofile

pprof Interactive Mode

Kita dapat mengetik help untuk melihat command yang tersedia.
Salah satu command yang bisa kita gunakan adalah top. Ini untuk melihat fungsi yang paling banyak memakan resource.

pprof top command

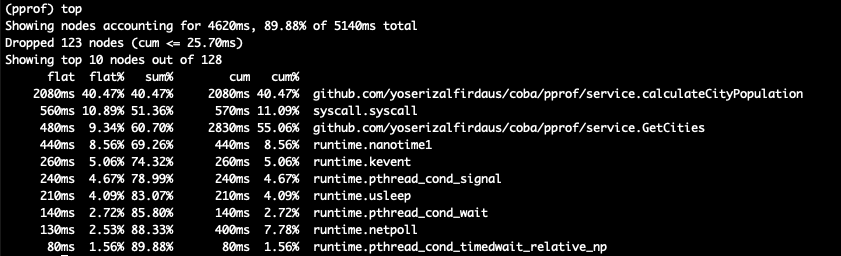
Dari hasil di atas, kita dapat melihat bahwa fungsi calculateCityPopulation adalah fungsi yang paling banyak menggunakan CPU. Kita dapat mencoba-coba command lainnya dan melihat bagaimana hasilnya.

Sekarang kita coba gunakan web interface. Untuk menganalisa hasil pprof pada web interface, gunakan command berikut:

go tool pprof -http localhost:3435 myappprofile

Parameter localhost:3435 adalah alamat untuk mengakses web interface nya. Kita dapat mengubahnya sesuai keinginan. Sekarang coba buka alamat tersebut di web browser. Kita akan melihat grafik seperti ini:

pprof Graph

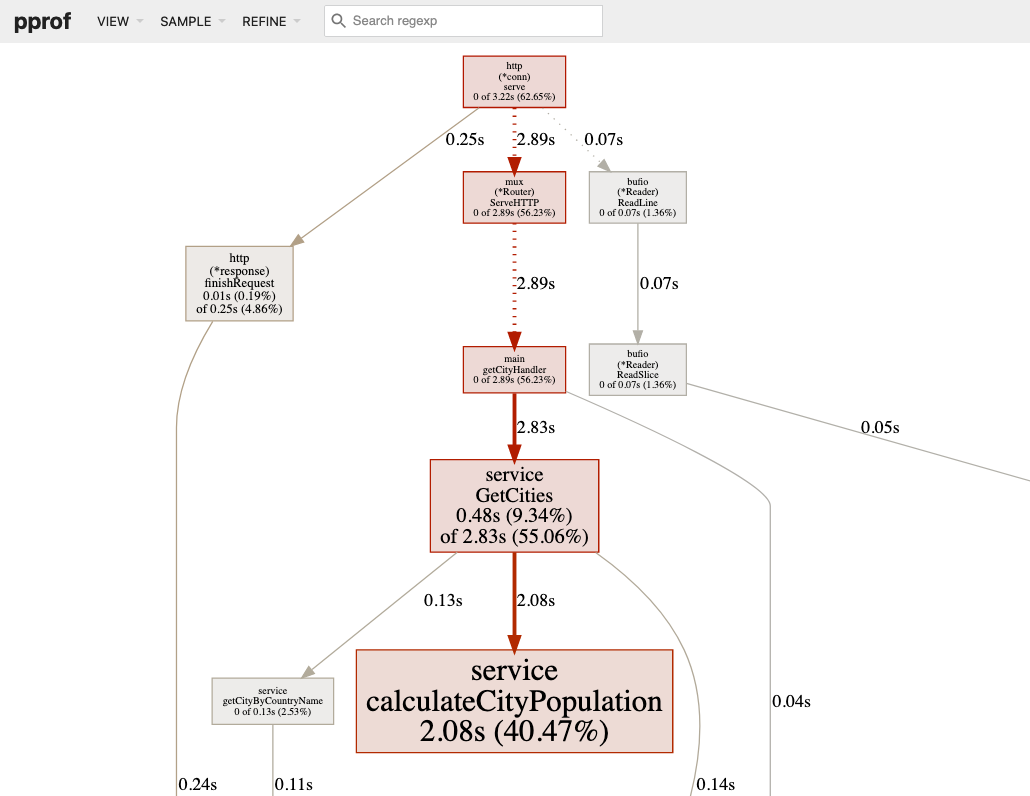
Kita bisa lihat bahwa fungsi calculateCityPopulation adalah kotak terbesar dan yang warnanya paling merah. Ini adalah fungsi yang paling banyak memakai CPU. Pada grafik ini kita juga dapat melihat flow dari function-function yang dipanggil. Ini dapat membantu kita mengerti suatu aplikasi dan menganalisanya. Kita dapat mengubah tampilan dengan mengklik tombol VIEW. Dibawah ini adalah hasilnya dalam Flame Graph.

pprof Flame Graph

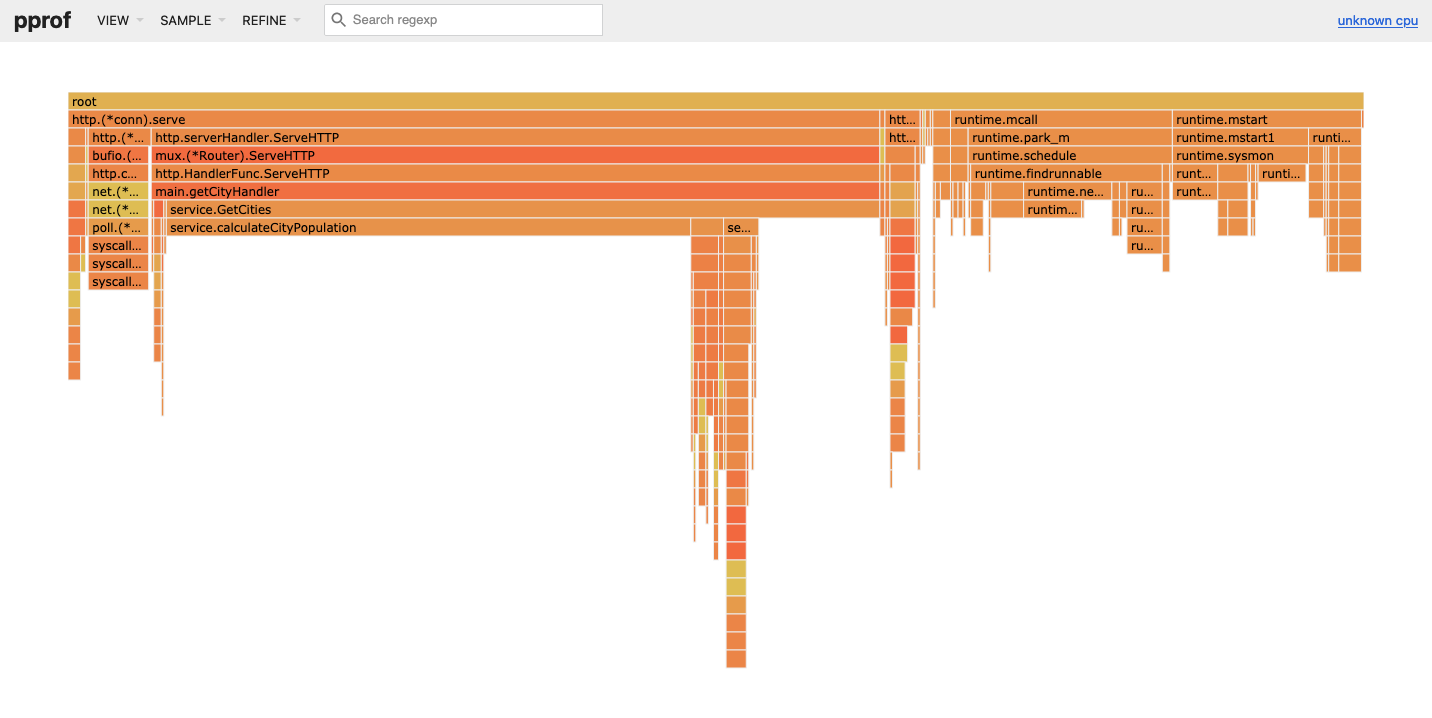
Saya sendiri lebih suka menggunakan web interface daripada interactive command line, karena lebih mudah digunakan. Grafiknya juga dapat mempermudah kita menganalisa aplikasi dan mengimprovenya.

Kesimpulan

Untuk melakukan profiling aplikasi Golang kita dapat menggunakan pprof. Tool ini dapat melakukan profiling saat aplikasi berjalan. Jadi kita dapat melakukannya kapan saja, terutama ketika hal misterius terjadi pada server kita. Lalu kita dapat menganalisanya dengan interactive command line atau web interface. Thanks for reading, leave a comment.

The complete code

The complete code is here (click to expand)
main.go
 1
 2
 3
 4
 5
 6
 7
 8
 9
10
11
12
13
14
15
16
17
18
19
20
21
22
23
24
25
26
27
28
29
30
31
32
33
34
35
36
37
38
39
40
41
42
43
44
45
46
47
48
49
50
51
52
53
54
55
56
57
58
59
60
package main

import (
	"context"
	"encoding/json"
	"fmt"
	"net/http"
	"time"

	"net/http/pprof"

	_ "github.com/go-sql-driver/mysql"
	"github.com/gorilla/mux"
	"github.com/yoserizalfirdaus/coba/pprof/service"
)

func main() {
	r := mux.NewRouter()

	r.HandleFunc("/get_cities", getCityHandler)
	
	r.HandleFunc("/debug/pprof/", pprof.Index)
	r.HandleFunc("/debug/pprof/heap", pprof.Index)
	r.HandleFunc("/debug/pprof/cmdline", pprof.Cmdline)
	r.HandleFunc("/debug/pprof/profile", pprof.Profile)
	r.HandleFunc("/debug/pprof/symbol", pprof.Symbol)
	r.HandleFunc("/debug/pprof/trace", pprof.Trace)

	fmt.Println("listening..")
	fmt.Println(http.ListenAndServe(":4560", r))
}

func getCityHandler(w http.ResponseWriter, r *http.Request) {
	ctx := r.Context()

	if !isLoggedIn(ctx, r) {
		w.Write([]byte("you need to login first"))
		return
	}

	countryName := r.FormValue("country_name")
	cities, err := service.GetCities(ctx, countryName)
	if err != nil {
		w.Write([]byte("got error: " + err.Error()))
		return
	}

	b, err := json.Marshal(cities)
	if err != nil {
		w.Write([]byte("got error: " + err.Error()))
		return
	}

	w.Write(b)
}

func isLoggedIn(ctx context.Context, r *http.Request) bool {
	time.Sleep(5 * time.Millisecond)
	return true
}

service/city.go
  1
  2
  3
  4
  5
  6
  7
  8
  9
 10
 11
 12
 13
 14
 15
 16
 17
 18
 19
 20
 21
 22
 23
 24
 25
 26
 27
 28
 29
 30
 31
 32
 33
 34
 35
 36
 37
 38
 39
 40
 41
 42
 43
 44
 45
 46
 47
 48
 49
 50
 51
 52
 53
 54
 55
 56
 57
 58
 59
 60
 61
 62
 63
 64
 65
 66
 67
 68
 69
 70
 71
 72
 73
 74
 75
 76
 77
 78
 79
 80
 81
 82
 83
 84
 85
 86
 87
 88
 89
 90
 91
 92
 93
 94
 95
 96
 97
 98
 99
100
101
102
103
104
105
106
package service

import (
	"context"
	"database/sql"
	"encoding/json"
	"fmt"
	"io/ioutil"
	"net/http"
)

var db *sql.DB

func init() {
	dtbs, err := sql.Open("mysql", "myuser:password@/mydb")
	if err != nil {
		panic(err.Error())
	}
	db = dtbs
}

func GetCities(ctx context.Context, countryName string) ([]City, error) {
	cities, err := getCityByCountryName(ctx, countryName)
	if err != nil {
		return nil, err
	}

	for k, v := range cities {
		lat, long, err := getGeoposition(ctx, v.Name)
		if err != nil {
			return nil, err
		}
		cities[k].Lat = lat
		cities[k].Long = long
	}

	calculateCityPopulation()

	return cities, nil
}

func calculateCityPopulation() {
	for i := 0; i < 500; i++ {
		for j := 0; j < 1000; j++ {
			k := i * j
			if k%1000 == i%100 && k%500 == j%200 {
				k = (i + 1) % (j + 1)
			}
		}
	}
}

type City struct {
	Name        string `json:"name"`
	CountryName string `json:"country_name"`
	Lat         string `json:"lat"`
	Long        string `json:"long"`
}

func getCityByCountryName(ctx context.Context, countryName string) ([]City, error) {
	rows, err := db.QueryContext(ctx, "SELECT name, country_name FROM city WHERE country_name = ?", countryName)
	if err != nil {
		return nil, err
	}

	var cities []City
	for rows.Next() {
		var city City
		err := rows.Scan(&city.Name, &city.CountryName)
		if err != nil {
			return nil, err
		}
		cities = append(cities, city)
	}
	return cities, nil
}

type geopos struct {
	Standard struct {
		City string `json:"city"`
	} `json:"standard"`
	Longt string `json:"longt"`
	Latt  string `json:"latt"`
}

func getGeoposition(ctx context.Context, cityName string) (lat, long string, err error) {
	url := fmt.Sprintf("https://geocode.xyz/%s?json=1", cityName)
	resp, err := http.Get(url)
	if err != nil {
		return "", "", err
	}
	defer resp.Body.Close()

	body, err := ioutil.ReadAll(resp.Body)
	if err != nil {
		return "", "", err
	}

	g := geopos{}
	err = json.Unmarshal(body, &g)
	if err != nil {
		return "", "", err
	}

	return g.Latt, g.Longt, nil
}

See also

comments powered by Disqus