As I have written before, monitoring your server’s metrics is important to maintain the reliability of your service. This article will show you the basics of monitoring your Golang application. The tools that we are going to use are Prometheus and Grafana.
We will use prometheus to scrape your application’s metrics. Prometheus provided us with a client library for Go, here https://github.com/prometheus/client_golang. After the metrics are successfully scraped, we can use grafana to visualize it. There are many insights you can get by exposing your app’s metrics, such as:
- requests per second
- error rate
- average latency
- and many more
You can also set an alert to notify you when some metrics go wrong.
In my previous post, I explained a little about how prometheus and grafana works. Also about how to get started using prometheus and grafana. If you are new to them or haven’t read the post yet, you may want to read it.
Metrics And Labels
Data stored in prometheus is identified by the metric name. Each metrics can have key-value variables called labels. Example of metric name is http_request_get_books_count with labels status to store the status of the API response (success / failed). The metrics will look like this:
# HELP http_request_get_books_count Number of get_books request.
# TYPE http_request_get_books_count counter
http_request_get_books_count{status="error"} 1
http_request_get_books_count{status="success"} 2
Labels can be very useful to filter or group the data. You can use it to analyze the metrics and improve your service.
How To Expose The Metrics
We need to provide an HTTP endpoint for prometheus to scrape the metrics. Prometheus provided us with the handler. You just need to include it in your HTTP server.
package main

import (
	"net/http"

	"github.com/prometheus/client_golang/prometheus/promhttp"
)

func main() {

	http.Handle("/metrics", promhttp.Handler())

	// ...

	println("listening..")
	http.ListenAndServe(":5005", nil)
}
Try sending a request to /metrics, you will get something like this:
# HELP go_threads Number of OS threads created.
# TYPE go_threads gauge
go_threads 8
# HELP promhttp_metric_handler_requests_in_flight Current number of scrapes being served.
# TYPE promhttp_metric_handler_requests_in_flight gauge
promhttp_metric_handler_requests_in_flight 1
# HELP promhttp_metric_handler_requests_total Total number of scrapes by HTTP status code.
# TYPE promhttp_metric_handler_requests_total counter
promhttp_metric_handler_requests_total{code="200"} 1
promhttp_metric_handler_requests_total{code="500"} 0
promhttp_metric_handler_requests_total{code="503"} 0
Those are built-in metrics. You can create your custom metrics using counter, gauge, or more advanced metrics such as summary or histogram.
How To Use Counter Metrics
A Counter is basic metrics that count value. The value can’t be decreased. An example of Counter usage is to count incoming request to your server. Below is an example to count a http_request_get_books_count metrics with status label. The counter is increased every time our endpoint is hit.
// create a new counter vector
var getBookCounter = prometheus.NewCounterVec(
	prometheus.CounterOpts{
		Name: "http_request_get_books_count", // metric name
		Help: "Number of get_books request.",
	},
	[]string{"status"}, // labels
)

func init() {
    // must register counter on init
	prometheus.MustRegister(getBookCounter)
}


func bookHandler(w http.ResponseWriter, r *http.Request) {
	var status string
	defer func() {
        // increment the counter on defer func
		getBookCounter.WithLabelValues(status).Inc()
	}()

	books, err := getBooks(r.FormValue("category"))
	if err != nil {
		status = "error"
		w.Write([]byte("something's wrong: " + err.Error()))
		return
	}

	resp, err := json.Marshal(books)
	if err != nil {
		status = "error"
		w.Write([]byte("something's wrong: " + err.Error()))
		return
	}

	status = "success"
	w.Write(resp)
}
Below are some examples of the metrics visualized with grafana.
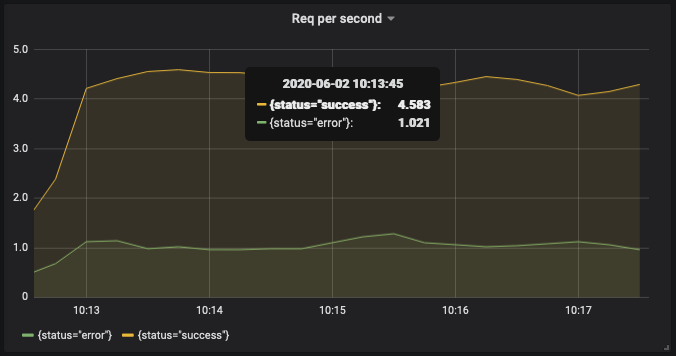
Request Per Second Graph
This is a request per second graph of get_books request grouped by status. The query:
sum(rate(http_request_get_books_count{}[1m])) by (status)
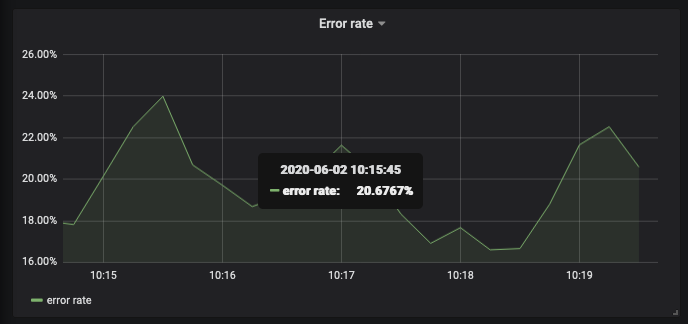
Error Rate Graph
This is an error rate graph of get_books request. We create this graph with query:
sum(rate(http_request_get_books_count{status="error"}[1m])) / sum(rate(http_request_get_books_count{}[1m]))
How To Use Histogram To Measure Duration
Another useful metric that usually measured is API latency. We can use Histogram to observe the duration of our API. A histogram observe the duration of our function and put it on a configured bucket. We can measure the quantile of a histogram using the histogram_quantile function.
var getBookLatency = prometheus.NewHistogramVec(
	prometheus.HistogramOpts{
		Name:    "http_request_get_books_duration_seconds",
		Help:    "Latency of get_books request in second.",
		Buckets: prometheus.LinearBuckets(0.01, 0.05, 10),
	},
	[]string{"status"},
)

func init() {
	prometheus.MustRegister(getBookLatency)
}

func bookHandler(w http.ResponseWriter, r *http.Request) {
	var status string
	timer := prometheus.NewTimer(prometheus.ObserverFunc(func(v float64) {
		getBookLatency.WithLabelValues(status).Observe(v)
	}))
	defer func() {
		timer.ObserveDuration()
	}()

    // the rest of the function...
Use histogram_quantile to measure quantile of the histogram.
To find quantile 0.95 the query would be:
histogram_quantile(0.95, rate(http_request_get_books_duration_seconds_bucket{status="success"}[1m]))
To find quantile 0.5 the query would be:
histogram_quantile(0.5, rate(http_request_get_books_duration_seconds_bucket{status="success"}[1m]))
To find the average duration, the query would be:
rate(http_request_get_books_duration_seconds_sum{status="success"}[1m]) / rate(http_request_get_books_duration_seconds_count{status="success"}[1m])
The visualized graph would be:
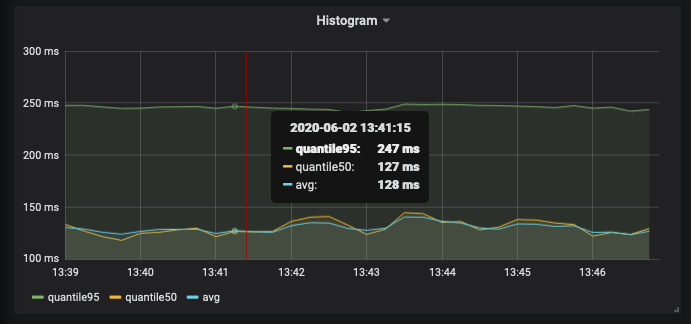
Note that when we use a histogram, prometheus also created a _count metrics automatically. So there is no need to create another counter.
Conclusion
These are just the basics of prometheus metrics that you can use to monitor your application. But it should be enough to set up your monitoring and alerting. There are more advanced metrics and configuration. For Histogram itself, you may need to experiment with bucket configuration to find the most suitable for your application.