Monitoring your server’s metrics is important to maintain the reliability of your service. You can also save costs by downgrading your server if the average load is much lower than the maximum capacity of your server. There are many ways and tools to monitor your server. One of the most popular is by using Prometheus to scrape and store the metrics. And Grafana to visualize the data. This article will show you how to monitor your server’s metrics with Prometheus and Grafana, especially for Linux servers.
The tools
The tools that we are using are node_exporter, Prometheus server, and Grafana. We will need docker to run the Prometheus server and Grafana.
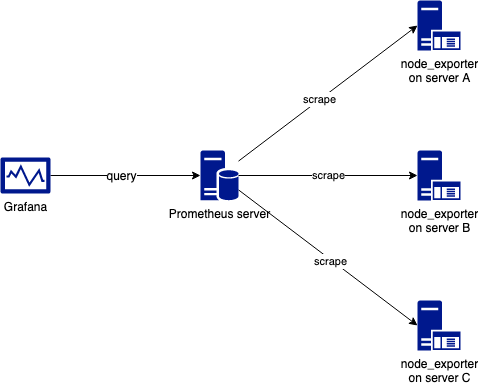
The node_exporter is a daemon that runs on your target server that exposes the server’s metrics. It needs to be installed on each of your target servers. It will handle /metrics API on default port 9100. The metrics will be scrapped by Prometheus and then stored on the database. Grafana will query the data from Prometheus and visualize it to various kinds of graphs.
The architecture will look like this diagram:
Expose The Metrics with node_exporter
SSH to your servers and download node_exporter package. If you want another version go to https://prometheus.io/download/#node_exporter.
wget https://github.com/prometheus/node_exporter/releases/download/v0.18.1/node_exporter-0.18.1.linux-amd64.tar.gz
Extract the package
tar xzvf node_exporter-0.18.1.linux-amd64.tar.gz
Go to the package folder and run the node_exporter on the background.
cd node_exporter-0.18.1.linux-amd64
./node_exporter &
In production, you may need some tools such as Ansible to automate these processes.
After you install and run node_exporter, hit /metrics on port 9100 of your server to verify it.
curl localhost:9100/metrics
You will see the metrics in something like this:
# HELP node_cpu_seconds_total Seconds the cpus spent in each mode.
# TYPE node_cpu_seconds_total counter
node_cpu_seconds_total{cpu="0",mode="idle"} 65486.1
node_cpu_seconds_total{cpu="0",mode="iowait"} 34.49
node_cpu_seconds_total{cpu="0",mode="irq"} 0
...
...
It means that your we can successfully scrape the metrics.
Scrape The Metrics with Prometheus Server
In this tutorial, we will install Prometheus server on docker. If you want to use another method, go to https://prometheus.io/download/.
First, we need to create a configuration file. Copy and paste the following code and save it as prometheus.yml.
global:
  scrape_interval:     10s

scrape_configs:
  - job_name: 'node'
    static_configs:
    - targets: ['192.168.100.17:9100']
This is a simple configuration file. The scrape_interval is how frequent the Prometheus server scrapes the target servers, scrape_interval 10s means that Prometheus will scrape every 10s. Put the IP of your servers in targets value. For more information about the configuration, go to https://prometheus.io/docs/prometheus/latest/configuration/configuration/.
Use this command to run Prometheus with docker. Don’t forget to change /path/to/your/prometheus.yml with the location of your file.
docker run -d \
    -p 9090:9090 \
    -v /path/to/your/prometheus.yml:/etc/prometheus/prometheus.yml \
    prom/prometheus
After it is successfully run, go to http://localhost:9090 to see the Prometheus dashboard.
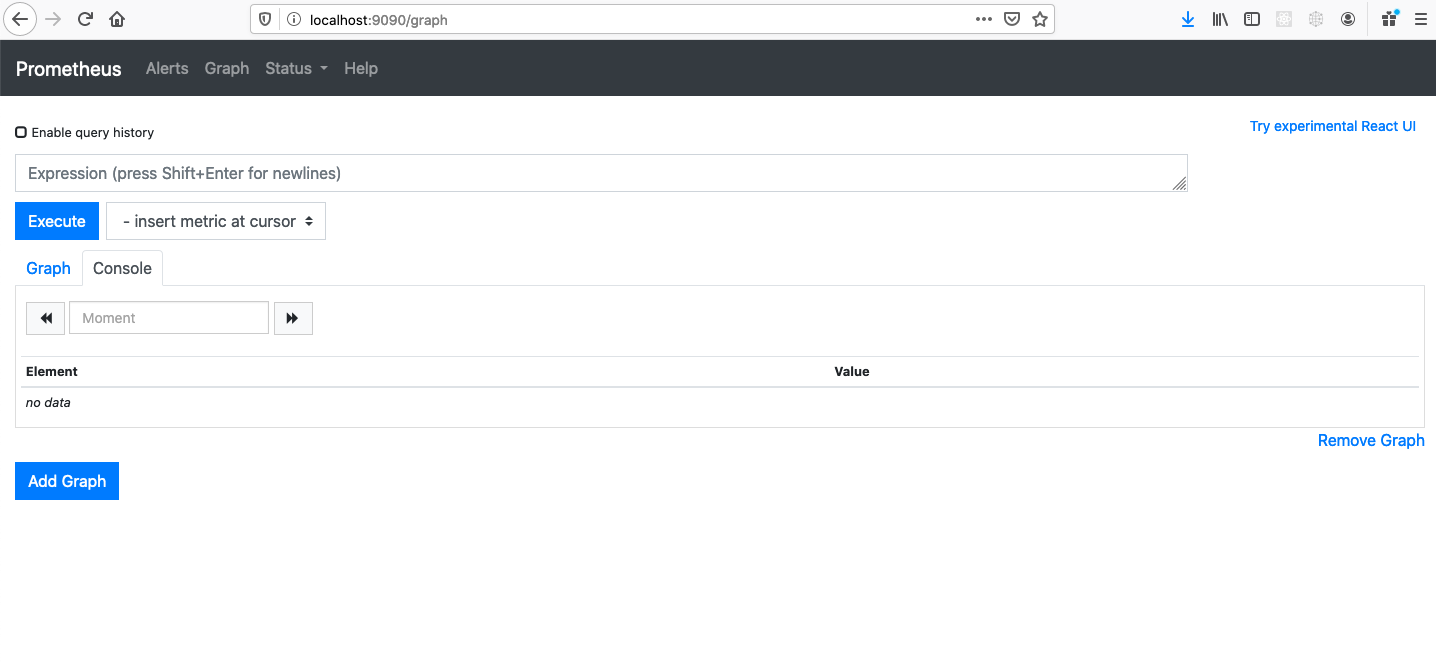
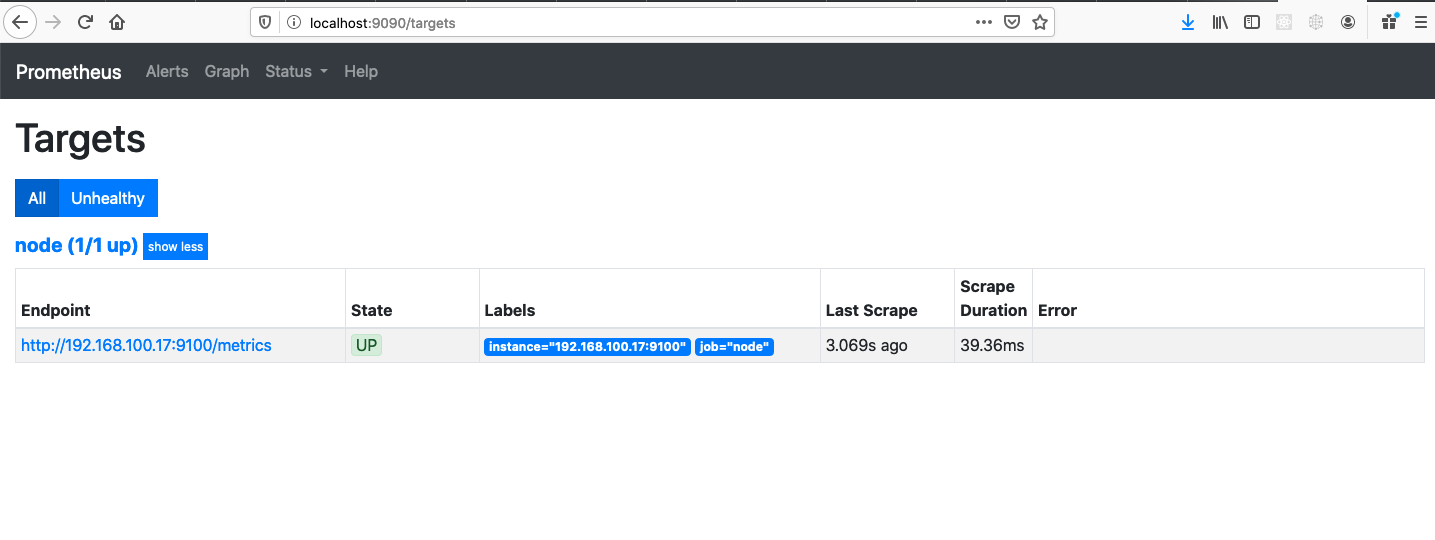
Click Status > Targets to see if your target servers are successfully scraped by Prometheus.
You can already query some metrics from your Prometheus. To do that, click Graph, and put avg by(instance) (node_load5) in the Expression field. It will show the load average of each server.
Visualize The Metrics with Grafana
Grafana is an open-source tool to monitor and analyze your metrics. We want to use Grafana to have a beautiful visualization of your metrics. It has many powerful features for monitoring and analyzing. It also has an alerting feature which is very useful. It is used by thousands of companies.
Use this run to install Grafana with docker. If you want another method, go to https://grafana.com/get.
docker run -d -p 3000:3000 grafana/grafana
Open http://localhost:3000/ to see the Grafana dashboard. Login with default username admin and password admin. After you login, make sure you change your password. You will see this page:
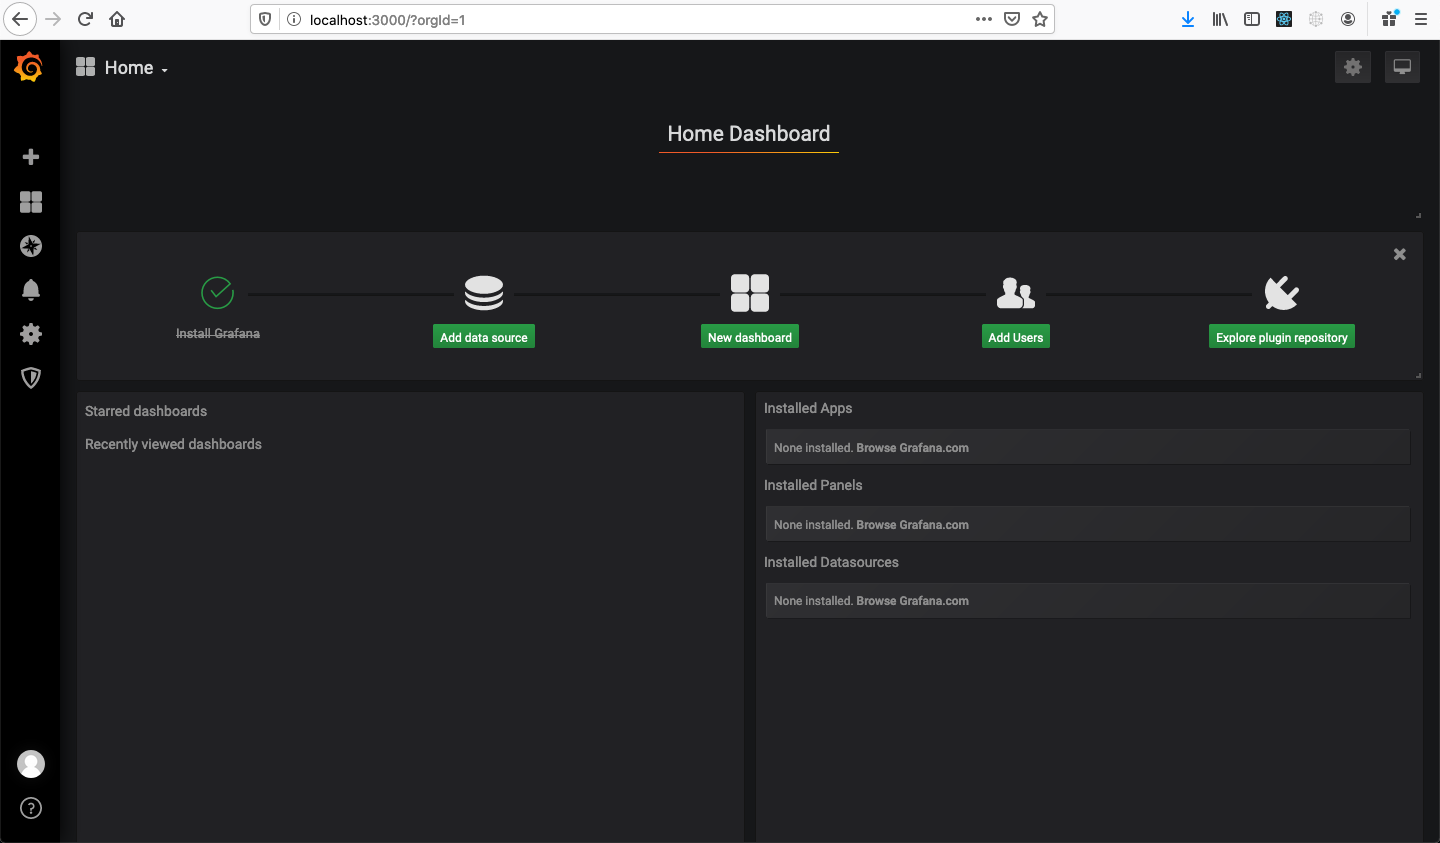
Click Add data source.
Select Prometheus.
Input name of the data source and URL of your Prometheus server. Leave other fields as it is for now.
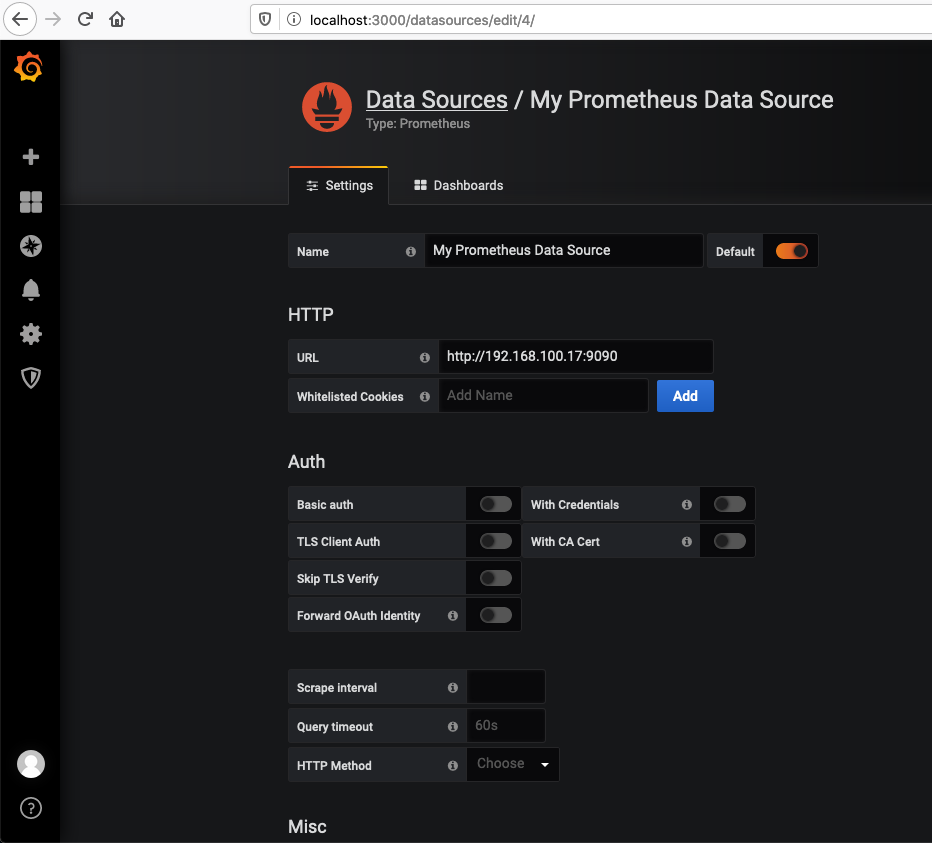
Click Save & Test.
Now go to Grafana Home and click New Dashboard, then click Add Query. Let’s use this query again avg by(instance) (node_load5) and see the graph.
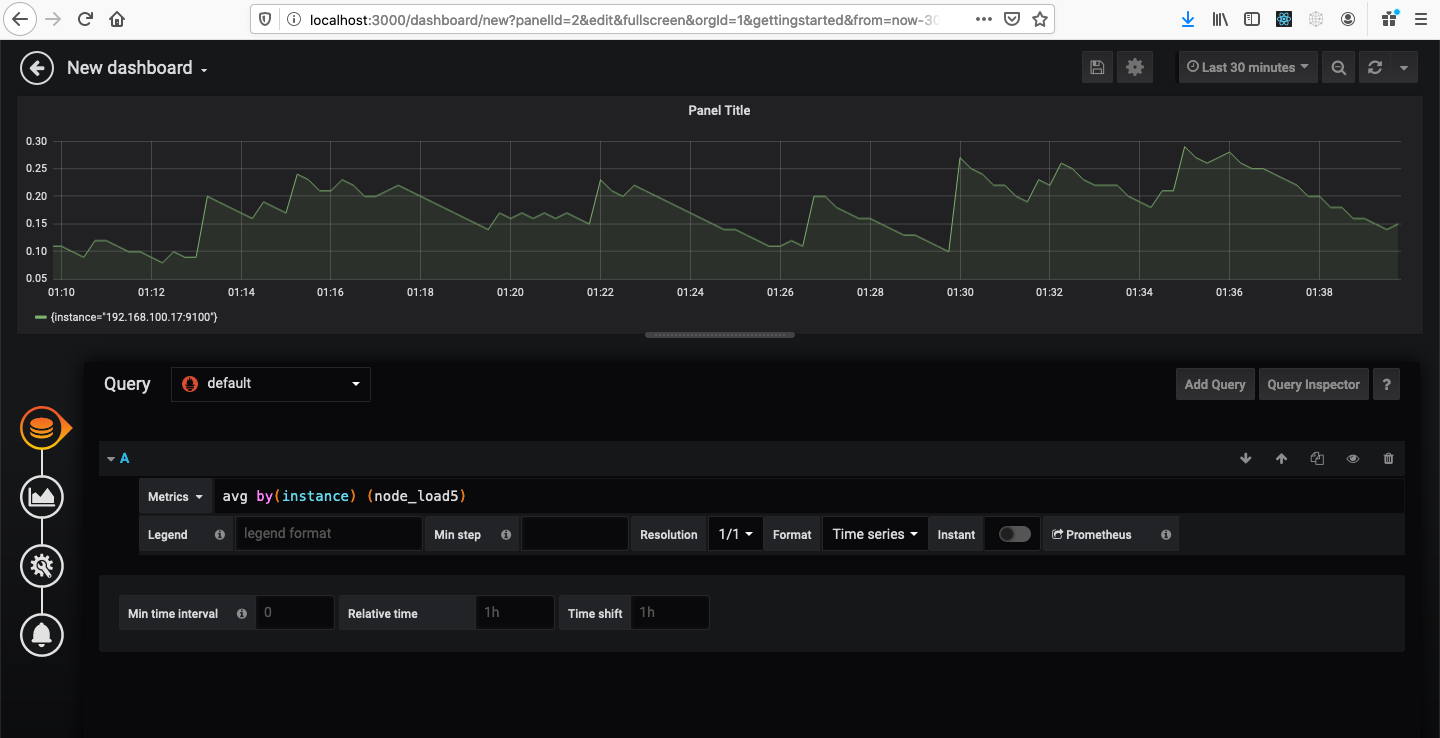
Try playing around with the graph and the dashboard.
Some Useful Query Sample
Below are some of the helpful query samples. For more info, https://prometheus.io/docs/prometheus/latest/querying/basics/#examples.
# cpu usage
100 - (avg by(instance)(irate(node_cpu_seconds_total{mode="idle"}[5m]))*100)

# memory used
node_memory_MemTotal_bytes{} - node_memory_MemAvailable_bytes{}

# disk space used
1-(node_filesystem_free_bytes{} / node_filesystem_size_bytes{})

# network received rate
rate(node_network_receive_bytes_total{instance=~'$node',device='eth0'}[1m])

# network transmitted rate
rate(node_network_transmit_bytes_total{instance=~'$node',device='eth0'}[1m])