Distributed tracing with Jaeger can be used to monitor error. We can find which span got an error and see the error log. This article will show you how.
Run Jaeger
To run Jaeger in local environment please follow the instruction here.
If you don’t know what Jaeger and distribution tracing is, I also suggest you read my previous article here.
If you have never integrated your app, I also suggest you read that article.
If you have successfully run Jaeger and integrate the basics, now it’s time to monitor errors.
Monitor errors
How to indicate error in a span
To mark a function that got an error we need to start span in the function and set the error tag to true. There is a library from opentracing to do that, that is opentracing-go/ext. See the example code below to indicate an error in a span.
| |
ext package from opentracing-go/ext. Let’s test it and see in JaegerUI.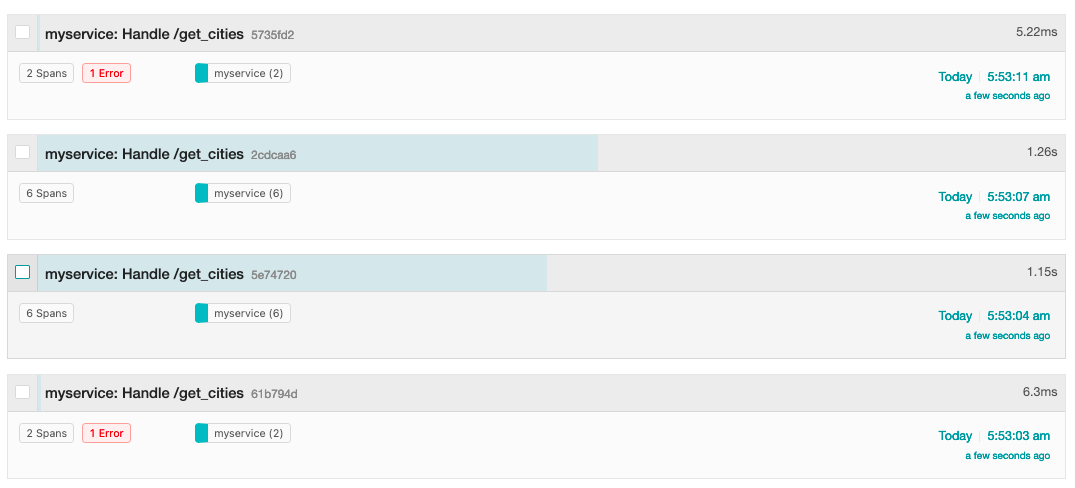
The image above is the traces in the search result. There is an error counter in a red box that says how many errors that trace has.
We can search for traces that got errors with the tags filter. Try search with tags error=true. It will only show traces that have an error.
Let’s click one of them to see the detail.
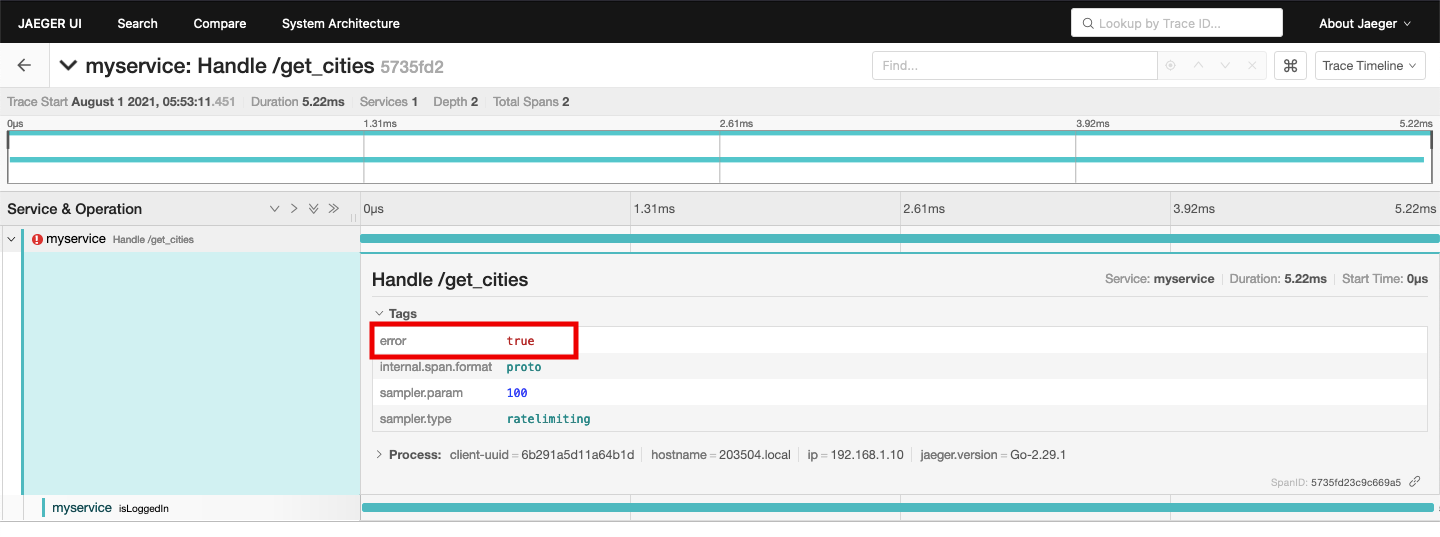
The span that got an error is marked with a red exclamation mark. We see in the span detail that the error tag was set to true. This is what tells Jaeger that the span has an error.
Log error in the span
We can add the error log in the span. Maybe that can help us identify the problem and fix it. Look at the code below to add the error log in the span.
| |
LogError from the ext package. We don’t need to set the error tag to true if we use the LogError function because the function already sets the error tag to true. Now let’s see the error span in JaegerUI.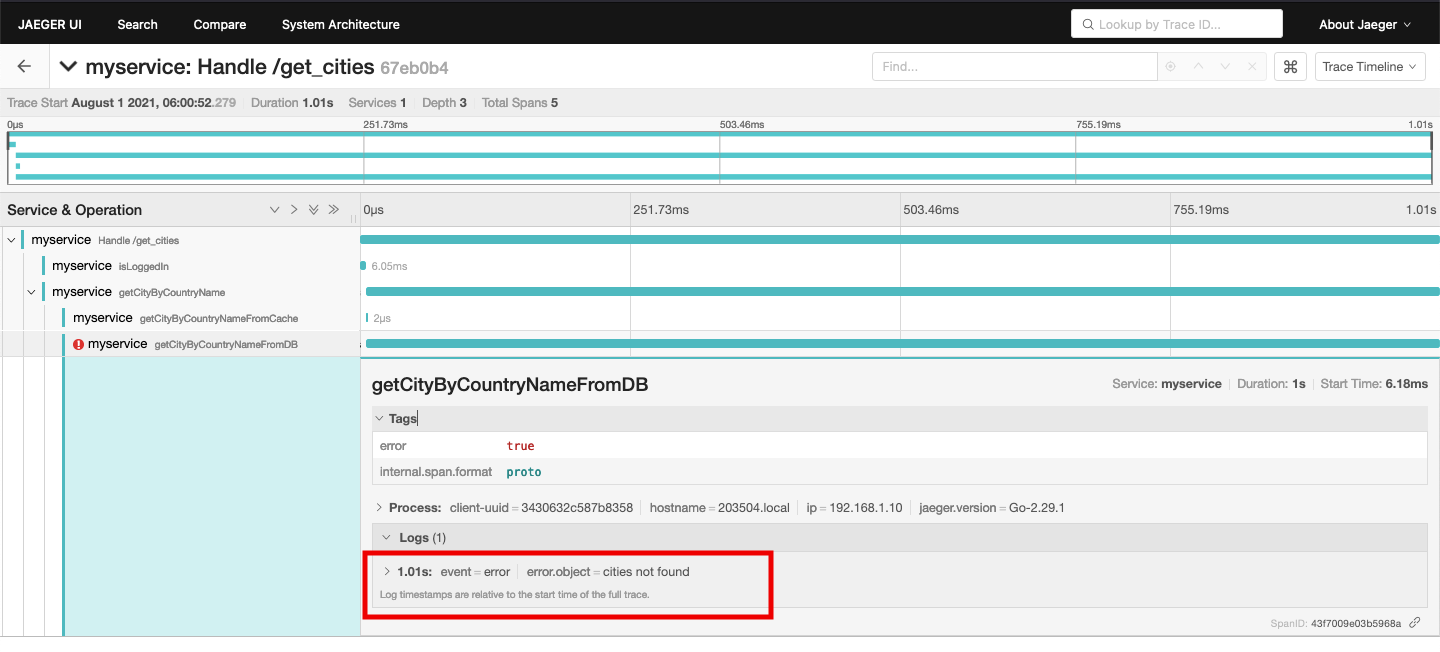
Add fields in the error log
Sometimes error log is not enough. We may want to add fields in the error log. We can do that. See the example code below.
| |
We can add more than one field in the logs if needed. Now let’s see it in the JaegerUI.
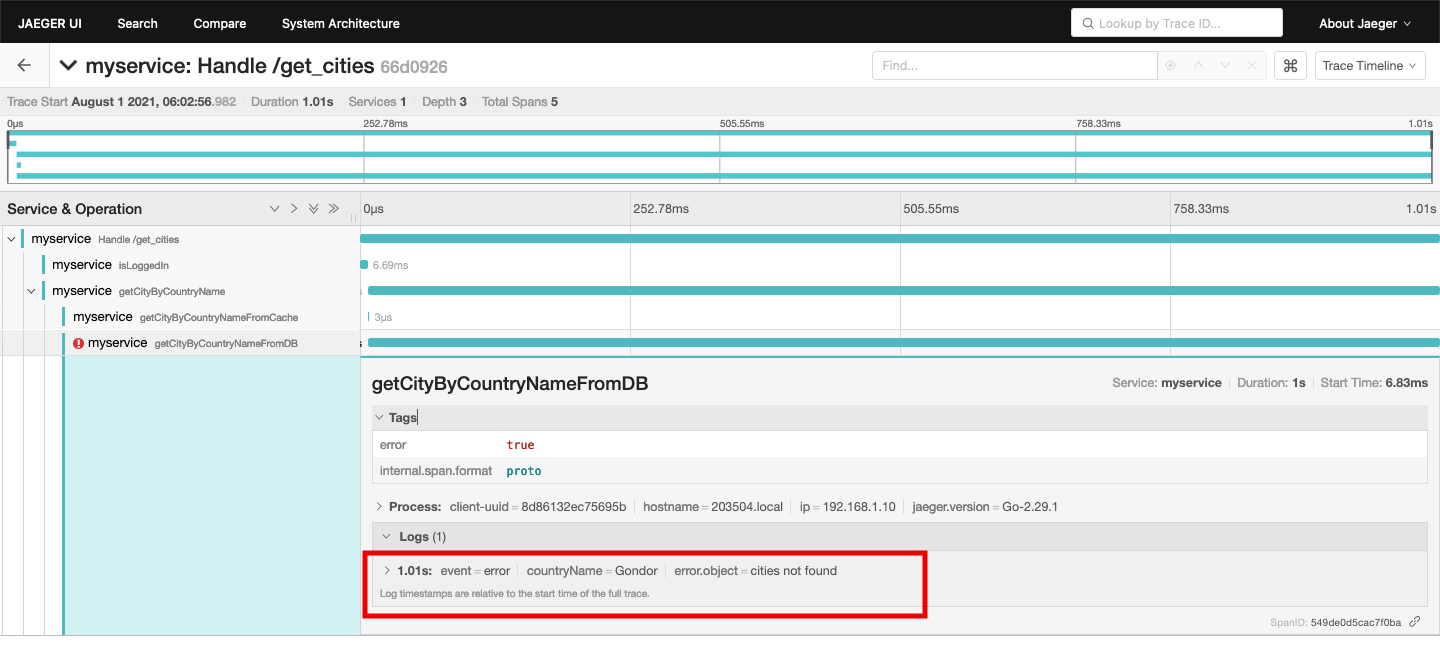
We see our field in the logs. Maybe with this, we can figure out the root cause of the error.
Conclusion
We can monitor and search for traces that have errors in Jaeger. To do that we need to set the error tag of the span that got an error. We can also put the error log and fields to help us identify the problem. Opentracing has a standard library to do this, so the integration should not be difficult.