Profiling A Go App With pprof

Profiling A Go App With pprof

Profiling an application is helpful to identify resource consumption at runtime. We can see which function consumes the most CPU or memory. We can see if our application is already efficient or not and then find a chance of improvement. In Go, there is pprof, a built-in library for profiling that we can easily use and integrate.

How to integrate pprof

To integrate pprof into our application we need to import net/http/pprof and create handlers for the profiling functions. If your application is a web server and are using a default HTTP server, you can just import the library as a blank identifier, like this:

import _ net/http/pprof

But most likely you are not using the default HTTP server. In that case you need to create this handlers:

    r.HandleFunc("/debug/pprof/", pprof.Index)
    r.HandleFunc("/debug/pprof/heap", pprof.Index)
    r.HandleFunc("/debug/pprof/cmdline", pprof.Cmdline)
    r.HandleFunc("/debug/pprof/profile", pprof.Profile)
    r.HandleFunc("/debug/pprof/symbol", pprof.Symbol)
    r.HandleFunc("/debug/pprof/trace", pprof.Trace)

Now we can do the profiling once our application is running.

How to do the profiling

To test it, I created a handler that selects data from a database, hits a third-party API, and does a calculation that consumes a lot of CPU. Then hit the server continuously for 5 minutes while doing the profiling. To do the profiling, we can call the /debug/pprof/profile and specify how long it will run in the seconds parameter, then save the result in a file. This is the command for that using curl:

curl --output myappprofile "localhost:4560/debug/pprof/profile?seconds=300"

Wait until the profiling finish and then we can analyze the result.

How to analyze pprof result

Now that we have the pprof file, we can analyze it using go tool pprof. We can analyze it in an interactive command line or a web interface.
To open it in an interactive command line:

go tool pprof myappprofile

pprof Interactive Mode

We can type help to see a list of available commands.
One of the commands is top. It is to see the top function that consumes resources the most.

pprof top command

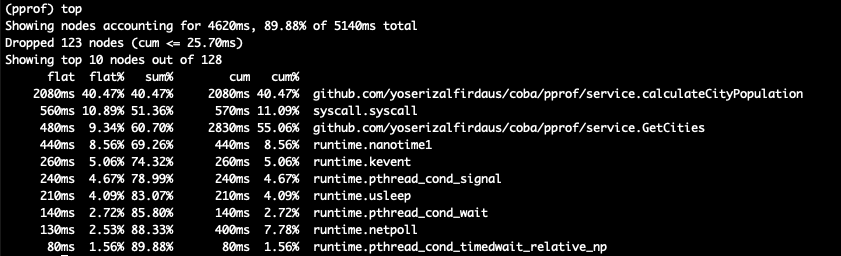
From the result, we can see that my calculateCityPopulation function is the one that consumes the CPU the most. Try to explore by using any of the available commands and see the result.

Now let’s try the web interface. You may need to quit the interactive mode if you are still in it. To analyze pprof result in the web interface, use this command:

go tool pprof -http localhost:3435 myappprofile

The localhost:3435 is the address to access the web interface. You can change it if you want. Now open the address in a web browser. You will see a graph like this:

pprof Graph

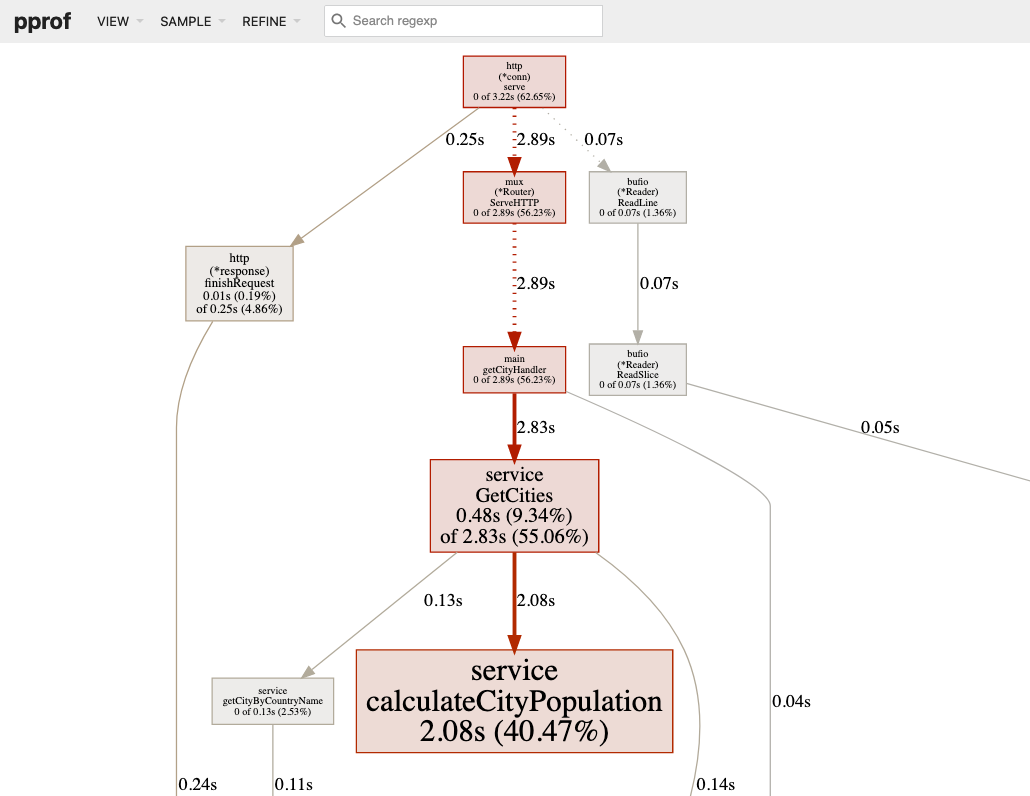
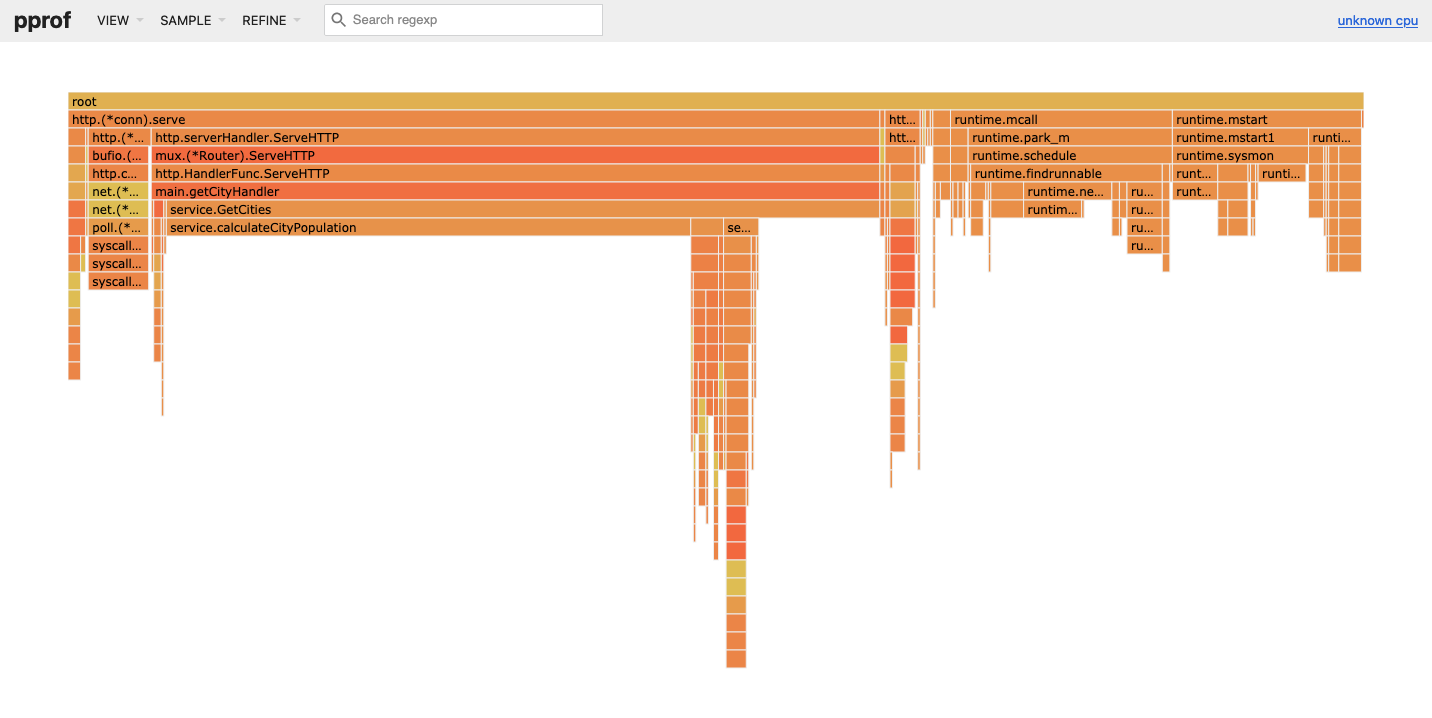
You can see that the calculateCityPopulation is in the biggest box and reddest color. That is the function that consumes the CPU the most. In this graph, you can also see the flow of the function call. It can help to understand the application and analyze it. You can change the view by clicking the VIEW button. Below is the result in Flame Graph.

pprof Flame Graph

I prefer the web interface to the interactive command line because it is easier to use for a newbie. The graph also makes it easier to analyze the application and improve it.

Conclusion

The pprof is very useful for profiling a Go app. It can profile the application at runtime. So you can do it whenever some mysterious things happen on your server. Then analyze it with an interactive command line or web interface. Thanks for reading, leave a comment.

The complete code

The complete code is here (click to expand)
main.go
 1
 2
 3
 4
 5
 6
 7
 8
 9
10
11
12
13
14
15
16
17
18
19
20
21
22
23
24
25
26
27
28
29
30
31
32
33
34
35
36
37
38
39
40
41
42
43
44
45
46
47
48
49
50
51
52
53
54
55
56
57
58
59
60
package main

import (
	"context"
	"encoding/json"
	"fmt"
	"net/http"
	"time"

	"net/http/pprof"

	_ "github.com/go-sql-driver/mysql"
	"github.com/gorilla/mux"
	"github.com/yoserizalfirdaus/coba/pprof/service"
)

func main() {
	r := mux.NewRouter()

	r.HandleFunc("/get_cities", getCityHandler)
	
	r.HandleFunc("/debug/pprof/", pprof.Index)
	r.HandleFunc("/debug/pprof/heap", pprof.Index)
	r.HandleFunc("/debug/pprof/cmdline", pprof.Cmdline)
	r.HandleFunc("/debug/pprof/profile", pprof.Profile)
	r.HandleFunc("/debug/pprof/symbol", pprof.Symbol)
	r.HandleFunc("/debug/pprof/trace", pprof.Trace)

	fmt.Println("listening..")
	fmt.Println(http.ListenAndServe(":4560", r))
}

func getCityHandler(w http.ResponseWriter, r *http.Request) {
	ctx := r.Context()

	if !isLoggedIn(ctx, r) {
		w.Write([]byte("you need to login first"))
		return
	}

	countryName := r.FormValue("country_name")
	cities, err := service.GetCities(ctx, countryName)
	if err != nil {
		w.Write([]byte("got error: " + err.Error()))
		return
	}

	b, err := json.Marshal(cities)
	if err != nil {
		w.Write([]byte("got error: " + err.Error()))
		return
	}

	w.Write(b)
}

func isLoggedIn(ctx context.Context, r *http.Request) bool {
	time.Sleep(5 * time.Millisecond)
	return true
}

service/city.go
  1
  2
  3
  4
  5
  6
  7
  8
  9
 10
 11
 12
 13
 14
 15
 16
 17
 18
 19
 20
 21
 22
 23
 24
 25
 26
 27
 28
 29
 30
 31
 32
 33
 34
 35
 36
 37
 38
 39
 40
 41
 42
 43
 44
 45
 46
 47
 48
 49
 50
 51
 52
 53
 54
 55
 56
 57
 58
 59
 60
 61
 62
 63
 64
 65
 66
 67
 68
 69
 70
 71
 72
 73
 74
 75
 76
 77
 78
 79
 80
 81
 82
 83
 84
 85
 86
 87
 88
 89
 90
 91
 92
 93
 94
 95
 96
 97
 98
 99
100
101
102
103
104
105
106
package service

import (
	"context"
	"database/sql"
	"encoding/json"
	"fmt"
	"io/ioutil"
	"net/http"
)

var db *sql.DB

func init() {
	dtbs, err := sql.Open("mysql", "myuser:password@/mydb")
	if err != nil {
		panic(err.Error())
	}
	db = dtbs
}

func GetCities(ctx context.Context, countryName string) ([]City, error) {
	cities, err := getCityByCountryName(ctx, countryName)
	if err != nil {
		return nil, err
	}

	for k, v := range cities {
		lat, long, err := getGeoposition(ctx, v.Name)
		if err != nil {
			return nil, err
		}
		cities[k].Lat = lat
		cities[k].Long = long
	}

	calculateCityPopulation()

	return cities, nil
}

func calculateCityPopulation() {
	for i := 0; i < 500; i++ {
		for j := 0; j < 1000; j++ {
			k := i * j
			if k%1000 == i%100 && k%500 == j%200 {
				k = (i + 1) % (j + 1)
			}
		}
	}
}

type City struct {
	Name        string `json:"name"`
	CountryName string `json:"country_name"`
	Lat         string `json:"lat"`
	Long        string `json:"long"`
}

func getCityByCountryName(ctx context.Context, countryName string) ([]City, error) {
	rows, err := db.QueryContext(ctx, "SELECT name, country_name FROM city WHERE country_name = ?", countryName)
	if err != nil {
		return nil, err
	}

	var cities []City
	for rows.Next() {
		var city City
		err := rows.Scan(&city.Name, &city.CountryName)
		if err != nil {
			return nil, err
		}
		cities = append(cities, city)
	}
	return cities, nil
}

type geopos struct {
	Standard struct {
		City string `json:"city"`
	} `json:"standard"`
	Longt string `json:"longt"`
	Latt  string `json:"latt"`
}

func getGeoposition(ctx context.Context, cityName string) (lat, long string, err error) {
	url := fmt.Sprintf("https://geocode.xyz/%s?json=1", cityName)
	resp, err := http.Get(url)
	if err != nil {
		return "", "", err
	}
	defer resp.Body.Close()

	body, err := ioutil.ReadAll(resp.Body)
	if err != nil {
		return "", "", err
	}

	g := geopos{}
	err = json.Unmarshal(body, &g)
	if err != nil {
		return "", "", err
	}

	return g.Latt, g.Longt, nil
}

See also

comments powered by Disqus